Indicators

Kenya Forest Indicators

Carbon Stocks

  • Governance Drivers 
  • Policy Drivers 
  • Economic Drivers 
  • Technology Drivers 
  • Cultural and Environmental Drivers 
Comparison of public and community/private forests

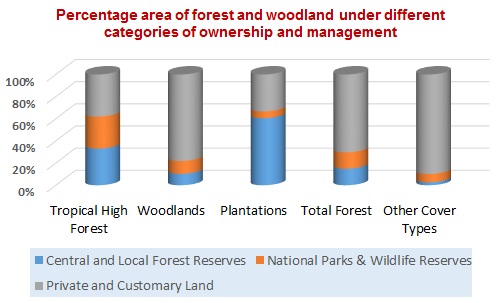
Most of the forest land in Kenya is under community and private ownership (77%) while the rest are under public (23%). Private plantations cover 47% of the total forest plantation area, which is almost equal to the area of stocked plantations under public management (53%)

Ecosystem Types

Forest Estates

Land use area changes in Kenya

People and Economy
  • Employment

    18,000 people are directly employed by the forestry sector, according to 2011 FAO data.

  • Economic Value

    The forestry sector contributed USD 365.1 million to the economy in 2011, which is approximately 1.2% of the GDP.

Statistics of Saw Mill and Plywood Industries

The demand for building construction, furnishing and other end uses for forest products have grown faster than the supply from Kenya’s forests, resulting in an increase in net imports. The two main direct value addition industries from wood from Kenya’s forests are saw mills and plywood industries

Total Forest Cover

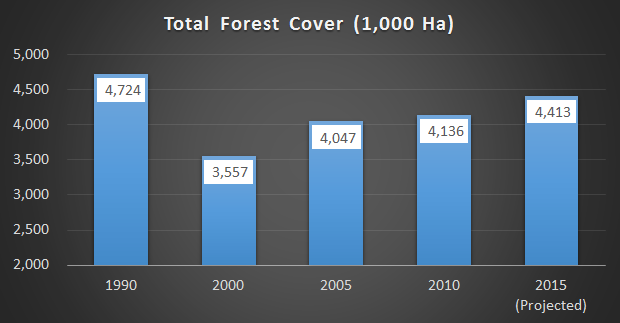
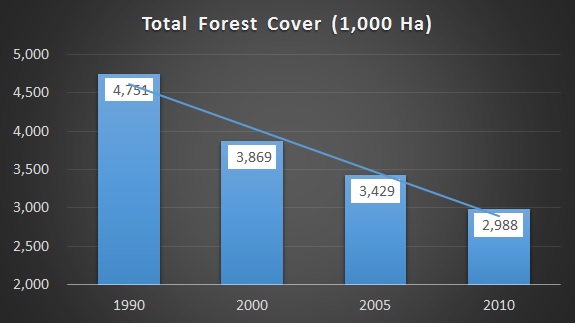
Between 1990 and 2000, Kenya lost approximately 1.2 million ha of forest land, equivalent to 25% of forest cover.

Tanzania Forest Indicators

Drivers of Deforestation and Degradation
  • Agriculture

    Monitored by Ministry of Agriculture, Ministry of Planning, Economy and Empowerment (Monitoring of National Strategy for Growth and Reduction of Poverty – NSGRP, also known as MKUKUTA)

    How is it Monitored

    • Crop productivity aggregated at four governance levels: village, district, regional and national
    • Shifting arable land with changes in temperature and precipitation as detailed in the National Investment Centre (NIC) and NAPA documents
    • Changes in cropping patterns (mono-crop vs. mixed) farming, timing (earlier or later), crop types, seed varietiesfertilizers, pesticides and herbicides
    • Percentage change in food crop production Ministry of Agriculture and Food Security (MAFS)
    • Percentage of smallholders using modern methods of farming (irrigation, fertilizers and improved seeds) National Bureau of Statistics (NBS)
    • Percentage of households whose main income is derivfrom harvesting, processing and marketing of natural resources products National Bureau of Statistics (NBS) or Ministry of Natural Resources and
    • Percentage of smallholders who have one or more off-farm income generating activities National Burea of Statistics
    • Percentage of smallholders who accessed formal credits for agricultural purpose (NBS)
    • How it Works

      Using the sibling and checked selectors, we can determine the styling of sibling elements based on the checked state of the checkbox input element. One use, as demonstrated here, is an entirely CSS and HTML accordion element. Media queries are used to make the element responsive to different screen sizes.

  • Commercial Logging and Charcoal

    Who is Monitoring

    Tanzania Forest Services and National Bureau of Statistics HBS/National Census

    How is it Monitored

    • Revenues from sale of forest products
    • Information related to illegal activities and changes in forest utilization
    • Percentage change in proportion of rural households reliance on forest products
    • Adoption of alternative livelihood activities
  • Woodfuels

    Who is Monitoring

    Ministry of Planning, Economy and Empowerment, Ministry of Energy and Tanzania Forest Service

    How is it Monitored

    • Percentage increase in number of customers connected to the national grid and off-grid sources of electricity Ministry of Energy and Minerals (MEM), National/Stations
    • Percentage of households in rural and urban areas using alternative sources of energy to wood fuel (including charcoal) as their main source for cooking NBS
    • Energy generation capacity by source (hydro, wind, solar, gas)
    • Percentage of population connected to the national grid
    • National energy generation capacity
    • Number of projects/programs on alternative energy sources
    • Proportion of households dependent on forests for energy resources
  • Forest Fires

    Who is Monitoring

    Tanzania Forest Service

    How is it Monitored

    • Hectares of land under forest fire annually
  • Infrastructure

    Roads generally result in increased deforestation and degradation (Nepstad et al. 2001). They make the transport of goods possible and economically viable, linking resources and producers to markets at lower costs.

  • Population Growth

    A large proportion of the population depends on forests in some way for their livelihoods or for their fuelwood, this consequently puts pressure on forests and land

Ecosystem Types

Estimated emissions

Forest Change Statistics

Forest change statistics (2002 – 2013) for Tanzania Mainland

Forest change statistics (2004 – 2012) for Zanzibar Island

Forest Cover Types

Forest Ownership

People and Economy
    • Employment

      7,000 people are directly employed by the forestry sector, according to 2011 FAO data.

Economic Value

The forestry sector contributed USD 612.9 million to the economy in 2011, which is approximately 2.7% of the GDP.

Total Forest Cover

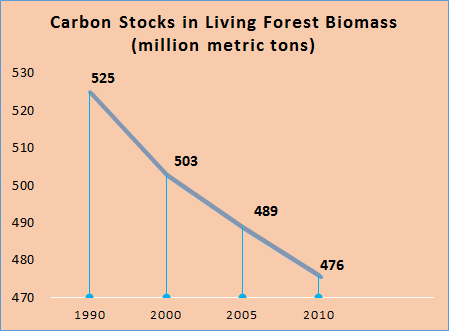
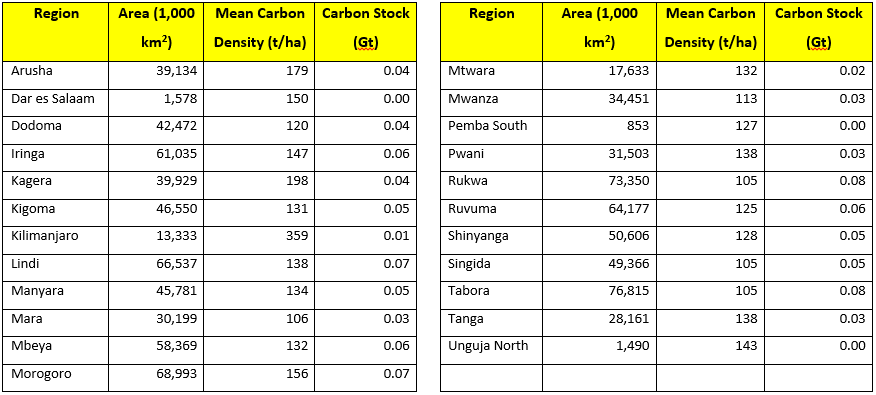
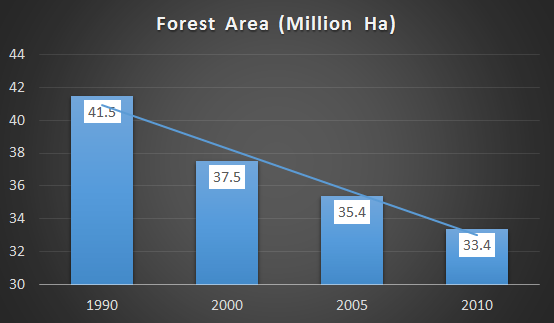
Trends in forest change from 1990 to 2010 showing an average loss of 403,328 ha per year

Total Forested Land
  • Forests include
    • Montane
    • Lowland
    • Mangrove
    • Plantation Forest
  • Woodland include
    • Open and Closed Woodlands
    • Thickets

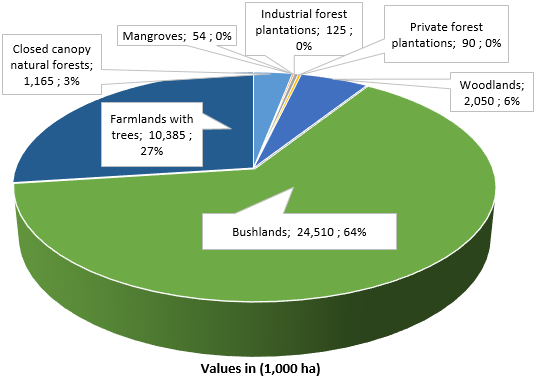
Woodlands occupy 93% of total forested land

Mozambique Forest Indicators

  • Commercial Agriculture

    Agents and Indirect Causes

    • Increased demand for agricultural products (tobacco, cotton, soybeans)
    • Infrastructure expanding
    • Political factors

    Main degradation activities

    • Selective wood cutting
    • Firewood collection
    • Hunting
    • Pastures
    • Fires

    Main deforestation activities

    • Large-scale production of sugarcane. producing vegetables, corn, soybeans, bananas
    • Small scale agriculture in a Outgrowing-system cotton, cashew, tobacco

    Results

    • Deforestation for establishing the commercial agriculture and forest degradation
  • Small Scale Farming Intinerant
  • Exploitation of Forests Product
  • Firewood and Charcoal
  • Urban Expansion and other Infrastructure
  • Mining
  • Livestock
Ecosystem Types

Forest Concessions Issued

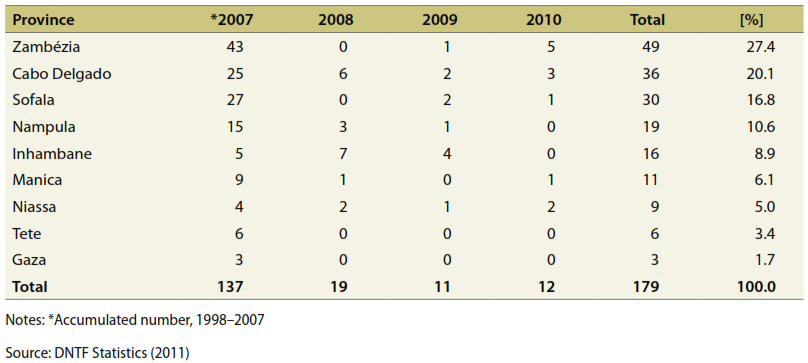
Number of forest concessions issued per year, 1998–2010

Forest classification based on usage

  • Production Forests: 26.9 million ha
  • Conservation Forests: 8.9 million ha
  • Protection Forests: 4.2 million ha
People and Economy
  • Employment

    22 thousand people are directly employed by the forestry sector, according to 2011 FAO data.

  • Economic Value

    The forestry sector contributed USD 330.3 million to the economy in 2011, which is approximately 2.8% of the GDP.

  • Types of taxes by logging companies, annual revenues from 2012-2016

    Types of taxes by logging companies, annual revenues from 2012-2016

Conversion rate USD$ 1 = 70.59 Mts


Statistics Derived from Forest Cover Map of 2007

Timber Production

Total Forest Cover

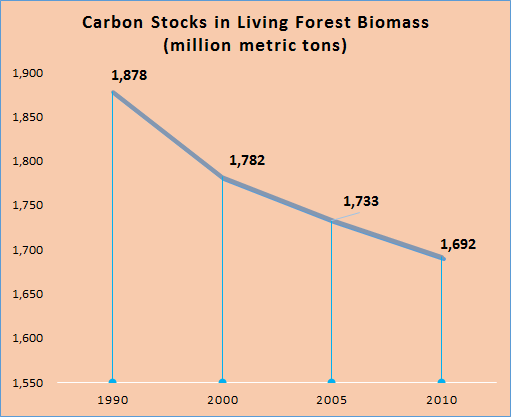
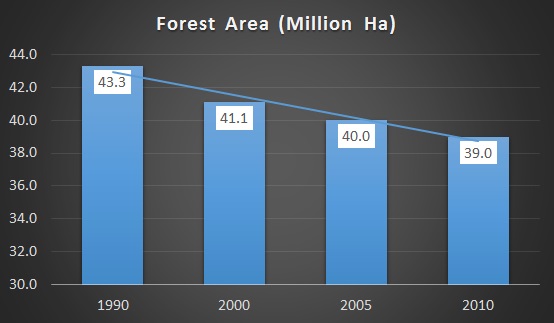
Between 1990 and 2010 Mozambique lost 10.0% of its forest cover, around 4,356,000 ha, whereby the average loss per year is 217,800 ha.

Uganda Forest Indicators

  • Expansion
  • Cutting of Trees for Charcoal
  • Cutting of Trees for Charcoal
  • Harvesting of Timber
  • LivestockGrazing and Bush Burning
Forest Ownership and Management

People and Economy
  • Employment

    12,000 people are directly employed by the forestry sector, according to 2011 FAO data.

  • Economic Value

    The forestry sector contributed USD 589.9 million to the economy in 2011, which is approximately 3.4% of the GDP.

Total Forest Cover

Trends in forest change from 1990 to 2010

Ethiopia Forest Indicators